In this article, we are going to see what information we need to collect for a manual backtest, particularly in forex; how to gather them, what can be found in a backtesting report and what do they tell us and how we can calculate the information we’ve gathered using Excel.
If you are new to backtesting and you want to know what the backtesting is or how we can backtest automatically and manually using multiple ways, you can check this post that I wrote about it, however, I tried to explain everything in a simple way so you’ll probably understand, even if this concept is new to you.
When we want to start backtesting, we need to know what factors and information we need to pay attention to at first. Then, there are some other information and factors we should collect during the backtesting, and in the end, we want to use them to calculate some metrics that tell us important information about our strategy.
Why do we do that and how do they help our strategy? Well, first of all, it tells us whether the strategy is profitable or not. If it’s not profitable, should we let it go, or it has the potential to be optimized and become profitable? Maybe the strategy is already profitable and we just want to optimize it and make it even more profitable.
For whatever reason we are going to backtest a strategy, we need to collect data first.
You can use this table of content to find the section you are interested in.
What Are the Initial Factors in Backtesting Strategies?
There are a few primary factors that we should consider before starting to gather data. We need them to give us an overview of what we’re going to do and how we can conduct backtesting. It’s more like a roadmap.
How Many Trades Are Needed For Backtesting
The first thing you have to consider when you want to backtest is that you need a reasonable number of trades or in other words, an acceptable amount of data to analyze.
You can’t understand if a strategy is profitable by testing a handful of trades. Let’s say you’ve tested 20 setups according to your strategy and entered the market 20 times. Do you think it’s a reliable sample size? Can you say that a strategy is a winning or losing one based on that number of positions?
I think it’s obvious that it’s very hard to rely on such a study and make decisions based on that. So what number of trades is reliable? The overall answer to this question is, the more the better.
If your strategy is coded and you have an EA for that, you have the chance to go deep and backtest your strategy with as many trades as your data allows. You can even buy more data for this purpose and let your EA backtests as much data as possible.
If your strategy is manual and you need to test it candle by candle or pattern by pattern annually, it’s almost impossible to find 2 or 3 thousand setups and test and record them one by one. of course, nothing is impossible but you would probably go nuts and end up killing yourself.
I would say 100 trades is something you can consider somehow reasonable in this situation. But I’ll do at least another 100 in a small real account before using it in my real account — a rather quick forward testing.
Timeframe
Timeframe is important because some strategies are designed for a specific timeframe and don’t have the same performance in other timeframes.
Imagine you have a strategy that can take 8 pips from 15min timeframe and let’s say it’s a winning one but with a small edge. It means a nominal disadvantage can make a big impact on it.
Now, what if we use the strategy in M5 or M1? Is it still profitable? It can hit an 8-pip target in M15, how many profits do you think it can take in M1 or M5? Probably not enough to survive and still be profitable.
That’s why we need to mention the timeframe that we are backtesting our strategy based on.
However, it’s not like that we can’t do multi-timeframe trading while backtesting. We can analyze based on multi-timeframe but we need to determine the timeframe we are testing based upon.
Strategy
When we are backtesting strategies we are either in the searching mode to find a strategy or we’re looking for a better strategy or we may be optimizing strategies. Therefore, we’ve backtested several strategies and we have to know what record is related to which strategy.
We should do this, even if it’s our first backtesting because we might lose track after backtesting several strategies.
Symbol
You should write the symbol of what you trade whether it’s a currency pair or stock. The reason is obvious. If you don’t know what you’ve backtested, how could you go back and analyze your data later!
Sometimes you are backtesting a strategy on several currency pairs, or stocks, etc. the strategy might work for one but not for the other, so you should know that.
Now we know how many trades we want, and we’ve indicated the sample size. We also know what timeframe is the target of our test. The strategy and symbol are determined as well. So we need to backtest our strategy to gather data so that we can analyze the strategy.
What Information Can Be Collected During Our Backtesting
Now, we need to know what information we need to gather during our backtesting so that we can analyze them after the backtesting is done. However, we don’t need to do so if we are doing automated backtesting because the software takes care of that and gives us a report in the end.
On the other hand, if we are going to backtest manually we need to do it all by ourselves. No help from a robot.
*I don’t know why it’s weird to me when I call an EA robot, scratching my head*
We don’t need to write down all of them completely except we want to have a complete journal of our trade with their details. We can just record the final results of some of them.
For example, instead of writing entry point, stop loss and take profit; we can jot down the amount of profit or loss that the trade gets. We’ll talk about this later. But for now, let’s take a look at all the information we can gather from our backtesting.
Date and Time
You have to know what is the date and time of each trade. There are some advantages of being aware of that especially for optimization. First off, when you finish backtesting, you can go through your report and find your winning and losing strategy and compare them to see how can you avoid losing ones and how can you increase the winning trades.
You can also look at the maximum number of losing or winning trades in a row. It’s called losing or winning streak. You may find a meaningful relationship between your losing streak and find the weak point of your strategy so that you either avoid those situations or somehow turn it into the strong suit of the strategy.
All in all, you need date and time to know what’s happened where, so you fix it if possible. If you use an automated strategy, date and time are automatically recorded and is presented in a report, but if you backtest your trading strategy manually, you have to do it the old way.
Type of Position
Are you taking a long position or a short one? In simple words, are you buying or selling? It’s not necessarily needed to record this one if your strategy isn’t designed according to the direction of the market — bullish or bearish.
You can skip this one if your strategy doesn’t have any relation to this parameter because when we record price information (entering price, stop loss, and take profit) you already know if the position is short or long.
Lot Size
If we use a static lot size for all the positions, we don’t need this one because, for example, we know that all the positions have been taken with 1 lot or 0.1 lot, etc. but sometimes there are strategies that use different lot size. For example, you enter the market with a lower lot as your initial position and if your strategy shows stronger signals and confirmation, you take bigger positions.
Another example is when you are testing a strategy on different pairs and you set let’s say 2% risk for each trade. If you don’t know the difference, you might want to check this out.
So if the lot size is variable write it, otherwise skip it.
Entry Point
It’s the price where we enter the market and take a position. We need to record that so that when we get back to analyze a position, we can find that easily.
Stop Loss and Take Profit
If we have a static SL or TP, we can skip this part because our strategy’s limitations don’t change from trade to trade. For example, we have 20 for TP and 10 for SL. But if we have variable limitations, we can record this one as well.
Profit or Loss
After we take the position, our position either hit the profit or loss. We need to write the amount of profit or loss that each position gets and write them separately. All the wins in one column and all the losses in another column.
By separating them, we can have an organized set of numbers that we need in the result section. We can use an Excel Spreadsheet for this purpose. We’ll talk about how we can use that in the next section.
We have to indicate all the above factors for each position we take during our backtesting, however, we can skip some of them based on our strategy or the intention of backtesting.
For example, if we don’t want to get back and optimize the trading strategy, and it’s just a backtest to see if the strategy is profitable, we can skip type of position and stop loss and take profit levels and price. We can go straight to wins and losses and write them down, or If we backtest one symbol and our lot size is static, we can skip writing lot size.
For instance, instead of writing, ok I enter in 4th of July (do it if you can) at 1.1010 in a buy position, my target is 1.1020, my stop loss is 1.1000 and the position hit the target and the profit is 10 pips; we can simply write July 4 = 10 pips
In conclusion, you need to look at your strategy and the intention of backtesting and pick those that are suitable for the whole purpose of your backtesting.
Finding the Results
After we’ve done all the above for each trade, now it’s time to do the math and figure out whether we should keep the trading strategy or throw it away or maybe we want to optimize it because we see the potential.
Number of Wins and Losses
We said in profit and loss section that we have to write the winning and losing trades in different columns. Now it’s time to count the number of each column.
Let’s say in profit column we have 10 trades and in loss column, we have 7 trades. Therefore our wins are 10 and our losses are 7.
Gross Profit
The sum of profits. For this, we have to sum up the amounts of profits we’ve collected according to profit and loss section.
Let’s say we have 60 winning trades in the profit section, each has gained $20 profit, so our gross profit is $1200(60*20)
Gross Loss
The sum of losses. For this, we need to sum up the amount of losing trades.
In the example above, let’s say we have 60 losing trades each with $10 loss. So the gross loss is $600.
Total Net Profit
For finding out how much we’ve gained or lost and see if the strategy is profitable, we need to calculate this one. It’s as easy as pie.
Gross Profit-Gross Loss
In our example, we’ve gained $1200 and lost $600 so the total net profit is $600 (1200-600).
Average Win
It means the amount of money we’ve gained on average for each trade. For this purpose, we have to divide Gross profit by the number of wins.
Gross Profit / Number of Wins
In our example, the gross profit is 1200 and the number of winning trades is 60, which means average win is 20. Therefore we’ve gained $20 averagely in each trade.
In this example, because all the trades have $20 profit, it’s clear that we don’t need to average them but in reality, we probably have different profits for our trades so it works there.
Let’s say we have 3 trades. These are their profits:
- 50
- 56
- 43
The average win here is 49.66
Average Loss
It means the amount of money we’ve lost on average. We use this formula for that:
Gross Loss / Number of Losses
In the example, we’ve lost $600 in 60 trades so the average loss is $10.
What Is the Benefit of Average Win/Loss?
The best result that can be inferred from this concept is to adjust our take profit and stop loss. It can give an overview of the best target for the limitation of the strategy.
We may have TPs that bring us $80 and the ones that produce $40. The average win here is $60, so we may want to modify the amount, however, our strategy may have different setups that each of them is designed for a specific amount of profit.
It’s up to the traders how to modify their strategy based on the knowledge they have about it. If there’s just one setup the strategy performs based on, you may consider optimizing the TP and SL regarding to the average win or loss.
Win Rate
Winrate shows how likely your strategy wins in a number of trades. It’s calculated by this:
(Number of Wins / Number of Trades) * 100
In our example, we have 60 winning trades and 120 total trades so the result is:
(60 / 120) * 100 = 50%
We win 50% of the time and lose in the other 50% but what makes our strategy profitable is our RRR or Risk to Reward Ratio.
Risk to Reward Ratio
RRR is a specific amount you are willing to risk in order to gain a specific amount of profit. In our example, we risk $10 to gain $20. The formula is easy.
Gross Profit / Gross Loss
1200 / 600 = 2
Thus, the risk/reward of our strategy is 2 or 1:2
We also can use average win or loss for calculating RR.
Average win / average loss
20 / 10 = 2
Drawdown
In simple words, it means an amount or percentage of decrease in your account. For example, you have $1000 in your account. You trade and lose $20. Your drawdown here is 2%. It means you’ve lost 2% of your account. How do we calculate it?
Loss / initial capital
And if you want the percentage, multiply the number by 100.
It was the primary explanation of drawdown so that we can get the gist of it but what if when we cover the loss and we make a profit.
First, let’s see before recovering from the above loss entirely and when we become breakeven.
Let’s say we make a trade and win $10. Now, according to our formula, we have a drawdown of 1% and if we trade and earn another $10, our drawdown here is 0.
Then, we win one trade, $20. We have $1020 now.no drawdown, why? Because we don’t have any losses at this moment and our account has $20 growth, according to our formula.
0 / 1000 = 0 then no drawdown here
In this position, we have a new capital that is bigger than our initial capital so if we lose some money, definitely we will, which one is the capital we need to use.
This is where we replace our previous formula with a new one — because we finally pull it off and are profitable, hooray!
* Is it really necessary to clown around in the middle of a serious discussion! *
Sorry! Back to work.
Our final formula is our loss divided by the maximum amount of our balance or capital or whatever you call it.
Loss / Max account balance
In the example above we have $1020 in our account which is bigger than the $1000 initial capital, so we use $1020 as the max balance.
We take another position and we lose $10. Now, what is the drawdown here? Our current loss in relation to the max account is $10(1020-10)
(10 / 1020) * 100 = 0.98%
Let’s put all the numbers in a table and add some additional numbers to them to see the whole picture better.
| Balance(B) | Loss(B-maxB) | Drawdown(loss/maxB) |
| 1000 | 0 | 0% |
| 980 | 20 | -2% |
| 990 | 10 | -1% |
| 1000 | 0 | 0% |
| 1020 | 0 | 0% |
| 1010 | 10 | 0.98% |
| 1060 | 0 | 0% |
| 1020 | 40 | -3.8% |
| 1030 | 30 | -2.8% |
As you can see we always calculate our loss in relation to the maximum balance of our account, in simple words, the whole loss from the biggest balance of the account so far.
Max Drawdown
When we have drawdowns, finding the maximum of them isn’t rocket since. In the above example, 3.8% is the max drawdown.
Max drawdown tells us how deep our account can lose money based on the strategy. The more this factor is the riskier the strategy is.

I think I’m not a good drawer. Maybe because I don’t have compartments!
Really, again? What a corny joke!
I want to be funny but I think I don’t have a sense of humor, or do I?
*wondering*
I wanted to draw a devil or something like that but it’s more like a mouse.
How to Use Excel to Calculate Backtesting Information
It’s laborious to do the math for every trade we’ve collected and takes a lot of time. So we need an excel spreadsheet to do that for us.
I was going to do that by myself and show that step by step but I decided to search to see if there is something valuable to do the trick for me.
I came across a very good youtube video that explains it well. Some names are different but the concept is the same as what we’ve covered here so far. it’s easy to understand and follow so you probably won’t have any problems.
There are other subjects in the video, so you can skip them and go straight to min 5:00
by the way, he doesn’t talk about the drawdown, so I’ll explain that in the next section.
How to Calculate Drawdown Using Excel
For calculating drawdown by Excel, first, we have to turn the formula in our table to an Excel formula. This is the formula we have to use:
MIN(0,(Balance cell-MAX($Balance
column$previous row number:Balance cell))/MAX($Blance column$previois row
number:Balance cell))
Really! This is what you call an easy-peasy approach?
Ok, don’t get panicky, we are not going to write them several times and it’s just a one-time task. Let’s do it step by step for our example from the table above.
For this purpose, we just need the balance column.
First things we need to do is open our Excel spreadsheet and enter the balance
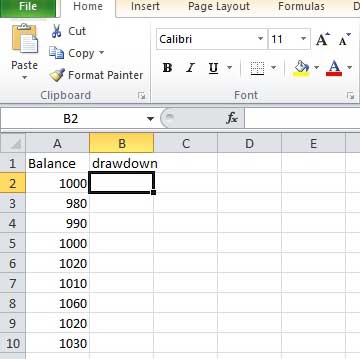
First balance, 1000, doesn’t have a drawdown because we haven’t traded yet so we don’t have any losses, therefore, we put zero for that.
Then we choose the second drawdown cell to write our formula inside. We either can write the formula directly inside the cell or in the formula section indicated by fx.
Wherever we choose, first we put = so that we determine we are going to write a formula. Then we write the first part of our formula,
MIN(0,(Balance cell
Where balance cell is A3 so the first part of our formula is
MIN(0,(A3

Then we get to the second part of our drawdown formula:
-MAX($Balance column$
The balance column here is A and when we put it inside $, When we put A inside $, we tell excel not to change that because we want to write our formula just for one cell and then the excel copies it for other cells. In other words, the column is always A and we change the address with row number, for example, A1, A2, and etc.so this part is:
-MAX($A$
And the entire formula so far is:
=MIN(0,(A3-MAX($A$
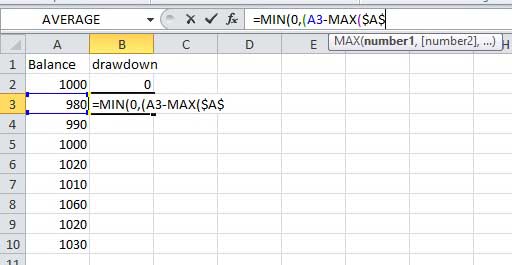
The next part of our excel drawdown formula is:
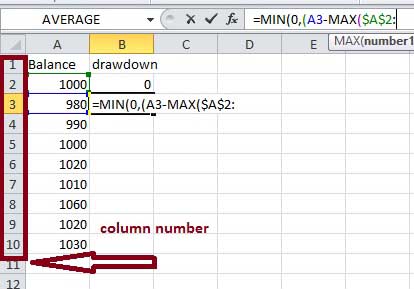
previous row number:
row numbers are on the left side of the excel spreadsheet, as we already know, so the current number is 3 thus, the previous one is 2.
The next part of the formula is:
Balance cell))
This is the same as the second step where we talked about. Therefore, the balance cell is A3 and the formula is:
=MIN(0,(A3-MAX($A$2:A3))
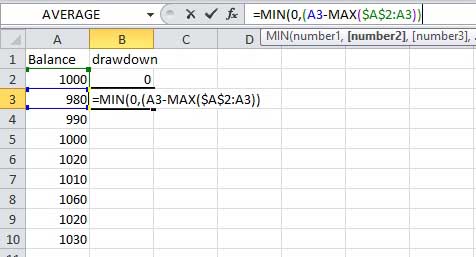
Now we have to divide this part by the next part. The next part is similar to the first part in terms of the factors, so you can fill that in like what you know now.
The complete formula is:
=MIN(0,(A3-MAX($A$2:A3))/MAX($A$2:A3))
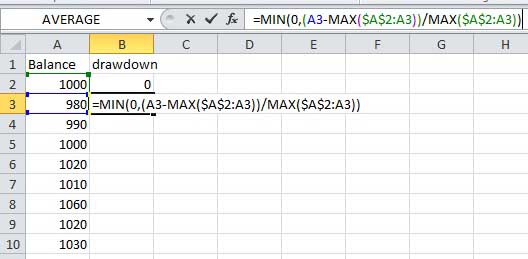
if you press enter, you’ll see the drawdown appear in the cell.
Now we are going to copy the formula for all cells so we can have the drawdown for the rest of the trades.
For doing that, choose the cell that has the formula (B3), click on the mouse and hold it, then drag it all the way to the entire column, column B)
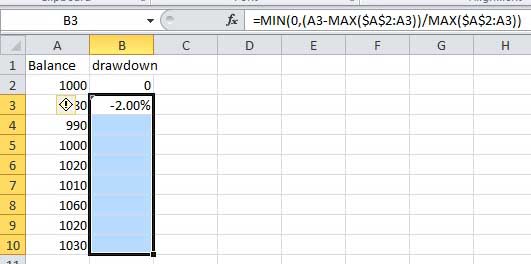
Then you either press enter or if it doesn’t work, find fill from the home tab, click on it and choose down. It fills the entire column and produces the other drawdowns. The position of the fill section might be different among different versions of Excel but it’s in the Home tab.

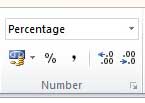
If you want to have the drawdowns in percentage form, find the percentage in the Home tab and press it. You can have a decimal version or a rounded one. Choose whichever that suits you.
Again, the section may be different in different versions of excel.
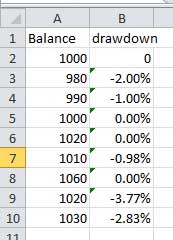
Your final results will be like the following picture. It’s the same as what we calculate for our table earlier.
How to Calculate Maximum Drawdown
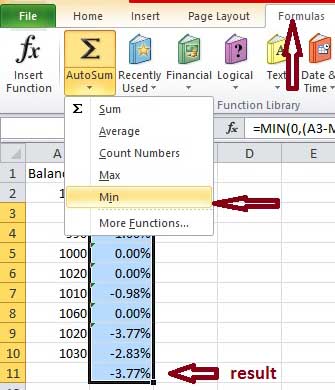
In order to find max drawdown, we have to find the minimum of drawdown column because the numbers are negative.
In our example, finding that is easy because we just have a handful of trades and the number of balance column is only 10. We can take a peek and find -.377% which is the minimum number and the maximum drawdown.
But what if we had thousands of trades. So there is a simple solution for that in excel.
For this purpose, first we need to select drawdown column again but this time we go one cell further because we want to see the result there.
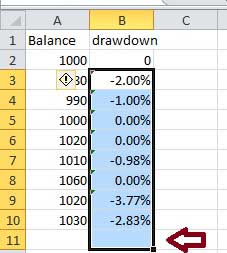
Then we go to formulas tab and click on the drop-down menu of Auto Sum. On the opening menu, press min. that’s it. Excel produces the maximum drawdown and places it in the extra cell.
The Bottom Line
There are three parts that we have to consider when we want to conduct a backtest. The first phase tells us the reliable scale of a backtest, the timeframe we want to backtest based on, the strategy we use for the backtest and the product we backtest.
The second phase is where we collect the necessary information in order to calculate some metrics that can reveal the strength and weakness of our strategy.
The last phase is the result part where we calculate the data gathered during the previous phase, and then we can analyze the final data and decide according to the result we’ve found out.
Calculating all the data in an absolute manual way is daunting and sometimes impossible. We can take a semi-manual approach with the assistance of excel. This way, we don’t need to do all the hard work by ourselves and excel can be a helpful aid here.
Don’t forget to check this post out if you are interested in manual backtesting using simulators.


Wonderful resources! Your help is greatly appreciated for a newbie Forex trader like me.
Thanks, happy to hear it helped you.