There is no doubt that MetaTrader 4 (MT4) is the most useful and practical platform of trading. The speed and compatibility of Metatrader are unparalleled. The only problem that MT4 has is its appearance which is as if we were living in 1990.
They try to make a few tweaks to it by releasing MT5, but nothing exceptional happened in terms of the whole skin and it’s still somehow ugly but of course loveable.
Here we are going to take a look at 11 simple tips and tricks for MetaTrader 4 tools which are located on the Line Studies of MT4 toolbar.
Line Studies is on the toolbar by default but if you can’t see that, you’ve probably messed with your MT4 and magically make it disappear 🙂 so you have to go to the view in the MT4 navigation bar, then choose toolbar and check Line Studies.

You can use the table of contents to find the section you want faster
Line Studies Toolbar
There are a variety of tools in Metatrader 4 that are used in different well-known strategies. Before getting to the tips and tricks, let’s take a look at them. If you are familiar with them feel free to skip this part and go straight to the MT4 tips and tricks section.
Trend Line
Let’s start with trendline. I don’t think that there’s a trader in the world that hasn’t used trend line, at least for some time. Traders use that for different purposes such as knowing the bias of a trend, or finding support and resistance.
There is another trendline called trend line by angle that you can use to find the degree of a trend or to see how sharp or mild a trend is.
Fibonacci
We have Fibonacci in different versions such as retracement, time zoon, arcs, fan, expansion, and channel. Traders use them because it’s believed that the price is inclined to react to the levels of Fibonacci such as 23.6, 38.2, 50, and 61.8 which are the most used and popular ones.
Andrews’ Pitchfork
Then we have pitchfork which invented by a well-known trader in the past called Alan H. Andrews. It’s composed of three channel-like lines. He believes that the price is around the middle line most of the time, so if the price goes far away beyond the middle line and gets to one of the other lines; it gets back to the middle line.
Gann
There is another tool that is named after the (so-called) legend trader William Delbert Gann. He used various methods for analyzing and predicting the market but the most popular one among traders is Gann fan. There are also other Gann tools in Meta Trader 4 toolbox such as Gann grid, and Gann n line.
Channels
Another tool is the equidistant channel which is comprised of two trend lines that show the minimum and maximum of a trend, or wave. For example, you can create a channel using this tool. Each of the two lines shows the minimum and maximum that a trend can go before it breaks them and changes the direction of the trend
There is another tool related to channels called linear regression channel. Like Andrews’ pitchfork or any other three-line channels, its main mission is to show the deviation of the price from the middle line and indicates the retracement of the price when it gets to one of the other two lines (the top or the bottom line), however, again like every other channels, breaking the two borderlines can indicate the direction change of a trend.
Vertical and Horizontal Lines
The horizontal line shows the price where it’s drawn. Traders use it for different purposes such as drawing support and resistance that show the important points of the chart in the past that have a high probability of price action in the future.
The vertical line shows the date and time of the price or candles. Traders use that when they want to know those parameters or if their analyses are based on the time and want to separate the chart according to the time sections.
Shapes
There are three shapes; rectangle, triangle, and ellipse, which you can use for any purposes. I normally use rectangle for finding take profits fast.
For example, you draw a box on a range area and if the price breaks that area, it’s very probable that it moves as the same as the size of that box or range. Although you can measure that with different methods, I like this one better because it’s easier.
Symbols
Then we have symbols. Again, you can use them for any purpose you need. I use up and down arrows to show the direction of the positions that I’ll take if I see the setups of my strategy forming.
When you analyze several charts and you have to switch between different charts, it comes in handy and makes you understand your bias fast.
Tips and Tricks for MT4
Before we get to the tips and tricks we have to point out something about Meta Trader 4 toolbox.
Insert and Remove Tools From MT4 Line StudiesToolbar
All the tools are not on the toolbar by default and we need to add the ones we want from customizing toolbar section. For knowing how to add tools to the MT4 toolbar, you should follow these steps:
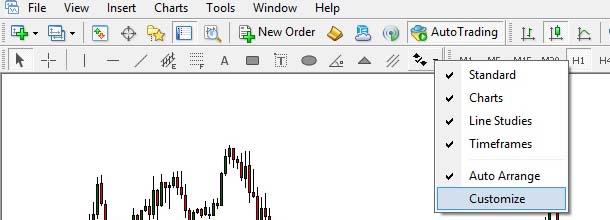
- Right-click on the MT4 Line Studies toolbar
- From the opening window, click on Customize
- From the left section (Available), double click on the tool you want to add

Instead of double click, you can also choose the tool and then press Insert. After you do either of them, the tool is added to the Selected section and you can see that on the MT4 toolbar.
If you want to remove any items from the toolbar, you can choose it from the Selected section and press the Remove button.
Ok, now let’s talk about MT4 tips and tricks
Draw Short Trend Line
Sometimes you want to draw a short trend line that hasn’t stretched to who knows where. For example, you want to draw triangles and after drawing you see two lanky creatures springing to the horizon, or you want to indicate some highs and lows but your chart cluttered with horizontal lines. So, how to shorten them?
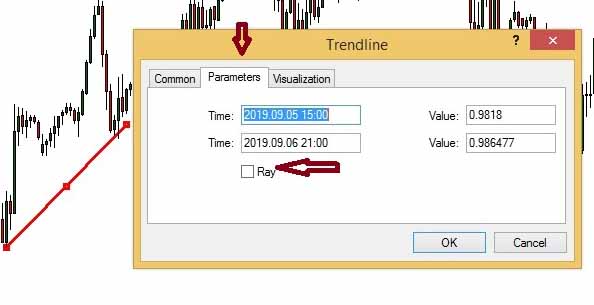
- Double click on the trend line to be selected
- Right-click on the Trendline and choose Trendline Properties from the opening window
- On the Trenline box choose Parameters section
- Uncheck Ray
How to See the Trendline Cross the Body of Candles?
It comes in handy when you are really precise in drawing a trendline and you want to see if the trend line crosses a candle and you can’t see that because the chart is on foreground.
Of course, it’s not just for trendlines and it’s the same for other drawing tools such as Fibonacci, channels, etc. it’s also the same for any indicators you use on the chart such as moving average, Bollinger Bands, etc.
For this purpose, follow the following steps:
- Right-click on the chart and choose Properties from the opening window (the last option on the bottom). Alternatively, you can find it from MT4 navigation bar and in the Chart section.
- Choose Common button on the top left of the Properties window
- Uncheck the Chart on foreground from the first left section


Then go to the trend line or any other tools you are using and make sure the Draw object as background in the Common section is unchecked. Of course, it’s unchecked by default and you probably don’t need to take any actions.

Moving Texts (The Difference between Text and Label)

The difference between Text and Label in MT4 is, the Text is static but the Label is floating.
When you want your writings stick to where you write them, you need to use Text. For example, when you number waves according to Elliot method and you don’t want them to tag along when you move the chart.
On the other hand, if you want the text to come along with you where you go on the chart, you can use the label. For example, you write some analysis or notes on the chart and you want to see if they are true when you are backtesting*.
* Backtesting is the process of testing your strategy in the past to see how it was performed*
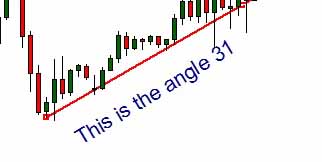
Text Rotation
Normally and by default, texts and labels in MT4 are placed on the chart horizontally. Sometimes you want to give degrees to them and make them diagonal.
For this reason, you need to follow this:
- Double click on the text or label to be selected
- Right-click on Text/Label and choose Text or label Properties
- From the text/label window choose parameters tab
- On the right section, change the Angle to what you desire

Change Fibonacci Levels
This is where you want to mess with Mr. Fibonacci and his discoveries and achievements. Not only do we have the power to change his levels but we can also add or remove the levels.
For example, instead of well-known Fibonacci levels, we can use 25, 50, 75 and 100 or you may not want to pick on great Fibonacci and just add another secluded Fibonacci line, 78.6, to the well-known levels.
Either way you can do that by following method.
- Double click on the Fibonacci tool to be selected
- Right-click on the Fibonacci tool and choose fibo properties
- on the fibo box, choose Fibo Levels tab
- in the Level section change the levels (you can change them in decimal format)
- in the Description section change the text format(25,75 etc.)

You can also add or remove levels by the buttons on the write section.
An Empty Shape
Shapes in Metatrader 4 are filled with color by default but sometimes you don’t want to see the color and you just want to have the borders.
For example, you want to draw a triangle and you want to see the lines clearly or you want to have an empty rectangle. For this purpose, you need to do the following things:
- Double click on the shape to be selected
- Write click and choose triangle/rectangle/ellipse properties (the
first option) - From the common tab, uncheck draw object as background

Copy a Tool
I like this one especially when I need several arrows and I don’t need to choose them one by one from the toolbar.
Of course, it’s not just for arrows and you can duplicate any tool from shapes to lines to even Fibonacci — I really don’t know why someone wants to have two identical Fibonacci!
It also very useful when someone wants to number waves while using Elliot strategy. sometimes there are several waves inside each other and you need a number several times.
The process is easy and like every other place when you want to copy something.
- Double click on the item to be selected
- Press Ctrl on your keyboard and hold it down
- Click on the item and move it
Change the Value of Horizontal Line
Sometimes you want to place a horizontal line on a specific price but you can’t find that price. The situation is worse as you switch to the higher timeframes because scales are larger in higher timesframes so if you want the line to be on the exact price you want, you’d better switch back to the lower timeframes.
To solve this problem, we have to change the value of the horizontal line from the horizontal line window.
- Double click on the horizontal line to be selected
- Right-click on that and choose horizontal line properties
- From the opening box, choose parameters tab and change the value

Wingdings and Arrow Codes
Wingdings and arrow codes are signs and symbols in Meta Trader that you can use for different purposes.

As I said before, I use up and down arrows a lot but there are various symbols that you can use for different reasons.
For example, when you are behind the chart for a long time and you are let’s say scalping but you have to call your girlfriend at 5, otherwise she kills you, you can use a phone symbol to reminds you what you’ve done to yourself.
Here is the list of all MT4 windings and arrows:

Delete Objects in Bulk
This one wasn’t in my primary list but as I was writing this post, I remembered that I use this one a lot.
Sometimes I clutter my chart with lots of tools and texts in order to show a setup or position to my friends or other traders or even for making a post like this.
Selecting them one by one in order to delete them is really a pain in the neck, but there is a simple trick for that.
For doing that, follow these steps:
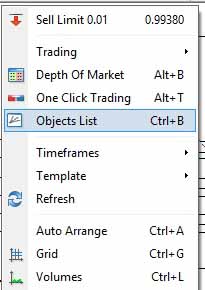
- Right-click on the chart and select Object List
- In the object list, check the objects you want to delete
- Press the delete button in the right section

Alternatively, you can choose the following direction to open the object list window.
On the MT4 navigation bar choose chart → object → object list.
The Bottom Line
In this post, I tried to talk about 11 tips and tricks that you can use for MetaTrader 4 so they may make your trading life easier. I personally use them and they’ve helped me in some respects.
When you are so busy with trading and sometimes you need to analyze the market fast, these kinds of small simple tricks or shortcuts if you will, can serve you well.
To wrap this article up, I’ll put an excerpt of the handiest tips at the bottom of this post, in case someone doesn’t feel like reading the whole article.
Double-click on the trendline to select it. then right-click on it then go this direction: trendline properties → parameters → uncheck ray
Rightclick on the chart and select object list then check all the objects and press delete button
double-click on the fibo to be selected. then right-click on it and choose fibo properties → fibo levels. in level section, select a level and change it. You have to enter decimal formats. For example, for 38.2 enter 0.382 or for 30 enter 0.3 etc.
Thank you very much David.
This is really educative. Despite having been playing around with Metatrader for over a decade, I just learnt the use of both pitch fork and Gann tool from you now and I have never rotated my text and put my TRENDLINES at a specific angle.
Now, what causes a trendline drawn on higher timeframe to always shift when one moves to lower timeframe when analysing chart?
Thank you.
David, thank you very much for sharing this, I have been looking for tools like this for quite a long time. It helps a lot :).
Happy to hear
Thanks a lot David, good tricks, they helped me a lot.