
Over the last 2 years, I’ve been experimenting heavily with AI and trading workflows. One thing became obvious pretty quickly: AI is actually very good at understanding chart structure visually.
Not perfect — but surprisingly useful.
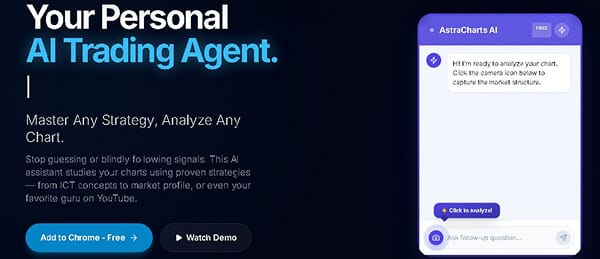
That realization eventually led me to build AstraCharts AI, a free Chrome extension that lets traders analyze charts on Tradingview , Metatrader web, and a few other web charting platforms directly from screenshots using AI models like ChatGPT, Claude, and Gemini.
The goal was never to create another “AI signals” tool promising impossible win rates. There are already too many of those.
What I wanted instead was an AI trading assistant that could help traders review charts faster, validate ideas, and apply their own trading strategies visually.
Because that’s how most discretionary traders actually trade.
We stare at charts, interpret context, look for structure, compare setups, and constantly second-guess ourselves before entering positions.
AI can genuinely help with that process.
But there’s also an important limitation that most people don’t talk about enough: AI models still cannot read charts images with perfect precision.
They can understand structure, trends, momentum, liquidity behavior, and general areas of interest remarkably well. But they are not reliable enough to give exact entries, stop losses, or take profit levels down to the pip or decimal, they need exact OHLC (Open, High, Low, and Close) price of candles / bars.
That’s an important distinction.
AI chart analysis from a screenshot works best as:
- a second opinion
- a chart-reading assistant
- a strategy review tool
- a faster technical analysis workflow
Not as a fully autonomous signal generator.
And honestly, I think that’s the more useful direction anyway.
How AI Trading Chart Analysis Actually Works
Most traders assume AI trading tools work like traditional bots that only process indicators and price feeds.
Visual AI analysis is different.
Modern multimodal AI models can interpret chart screenshots similarly to how a human trader reads a chart. They evaluate price action, candle structure, trend behavior, support and resistance zones, and overall market context directly from the image itself.
That’s especially useful for discretionary trading styles where context matters more than mechanical indicators.
For example, when I test AstraCharts AI on TradingView charts, the AI can usually identify:
- bullish or bearish structure
- breakout conditions
- consolidation ranges
- liquidity grabs
- trend continuation behavior
- potential areas of interest
- market imbalance zones
What it cannot do consistently is provide exact numerical precision.
If you ask AI for a perfect stop loss at 1.08427 or an exact support level down to the tick, the results can become unreliable because image-based AI still struggles with precise chart scaling and price-axis interpretation.
In practice, though, that rarely matters for the actual analysis.
Human traders don’t usually think in perfectly precise numbers either. We think in zones, areas, structure, context, and probability.
That’s where AI chart analysis becomes genuinely useful.
Why I Built AstraCharts AI
The original idea behind AstraCharts AI came from my own frustration with chart analysis workflows.
Most AI tools forced me to:
- manually upload screenshots
- explain the chart in text
- describe the timeframe
- explain the strategy
- rewrite the same prompts repeatedly
It felt clunky.
So I wanted something simpler.
The result was a Chrome extension that works directly on charting websites like TradingView. Once installed, a floating AI chatbox appears on the screen while you analyze charts normally.
When you want analysis, you simply click the camera button.
The extension captures the chart instantly and sends it to the AI model for review.
That workflow feels much more natural because it integrates directly into the trading process instead of interrupting it.
I also wanted traders to use their own analytical style rather than being locked into generic AI prompts.
That’s why AstraCharts AI supports custom strategy frameworks instead of forcing everyone into the same system.
AI Analysis Based on Your Own Trading Strategy
One thing I strongly disliked about many AI trading tools was how generic the analysis felt.
Every trader sees the market differently.
Some traders focus on liquidity and market structure. Others care more about volume behavior, trend continuation, reversals, or scalping setups. Many traders combine ideas from multiple mentors or develop their own systems over time.
So instead of making AstraCharts AI dependent on a single strategy, I built it around customizable analysis.
The extension includes a couple of default strategy templates simply to help users get started quickly, but the real strength is the ability to create your own framework.
You can provide:
- written strategy notes
- custom rules
- trading concepts
- educational material
- even YouTube videos from trading educators
The AI then converts that information into an analytical framework that can later be applied to chart screenshots.
That means traders can essentially teach the assistant how they personally think about the market.
And in my experience, that produces much more useful analysis than generic buy/sell signal tools.
Prompts for Trading Strategies
I’m testing different trading strategy prompts on AstraCharts AI to find the best formats. I’ll keep adding the ones that work best here as I test and refine them.
[You are a technical analyst specializing in divergence trading. Analyze the attached chart image using the following rules only — do not introduce concepts outside this framework.]
Don’t include the line above when using the prompt in AstraCharts AI. It’s intended for regular AI chatbots like ChatGPT, Claude, etc.
Divergence definition: Divergence occurs when price and an oscillator (RSI, MACD, or stochastic) move in opposite directions. It signals weakness in the current move and a possible reversal.
Types to check for:
Regular divergence in an uptrend: price makes a higher high, the indicator makes a lower high → sell signal
Hidden divergence in an uptrend: price makes a higher low, the indicator makes a lower low → buy signal
Regular divergence in a downtrend: price makes a lower low, the indicator makes a higher low → buy signal
Hidden divergence in a downtrend: price makes a lower high, the indicator makes a higher high → sell signal
Validity requirements (a signal must meet ALL of these to count as divergence):
Confirmed pivots only. Both the price swing and the indicator swing must be fully formed and closed — not the current forming candle or an in-progress high/low.
Visually obvious disagreement. Look at the two peaks (or troughs) on the indicator the way a trader would, at a glance, without measuring exact numbers. Ask: if I only looked at the indicator’s shape, would I clearly say “that’s a lower high” or “that’s a higher low,” the way I’d describe two visibly different mountain peaks? If the second peak is only marginally different, roughly the same height, a slight wiggle, a difference you’d only catch by reading the exact printed values, that does NOT count. Reject it and say so explicitly — describe what you see and why it falls short of a clear visual divergence.
Context weighting. State clearly whether the divergence is occurring on a correction within the main trend, or during an active impulse leg (new highs/lows still printing in the trend direction). If it’s occurring during an active impulse rather than a correction, downgrade it to “low-quality / early warning only,” not a primary signal.
Task:
Identify the current market trend (uptrend, downtrend, or ranging) from the chart.
Check the visible oscillator (state which one: RSI, MACD, or stochastic) for divergence against price, using the swing highs/lows shown.
If divergence is present, classify it as regular or hidden, and state whether it aligns with or goes against the main trend.
Flag whether the divergence occurs on a correction within the main trend (the highest-quality context per the rules above) or elsewhere.
State your conclusion clearly: no divergence found / divergence found — type, direction, and signal (buy or sell) / or divergence found but low-quality (not on a trend correction).
If a valid signal is found, suggest a stop loss and take profit level based on the visible chart structure, calculate the resulting reward-to-risk ratio, and give a worked example of the dollar risk on a $10,000 account at 2% risk per trade (e.g., “risking 2% on a $10,000 account risks $200; at a 1:2 RR, the potential gain is $400”).
Why Screenshot-Based Analysis Feels More Natural
Trading is visual.
Most discretionary traders spend their time watching:
- price structure
- trend development
- candle behavior
- breakout attempts
- liquidity zones
- reactions at key levels
That’s why screenshot-based AI analysis makes sense.
Instead of trying to explain a setup through text prompts, you can simply capture the chart and let the AI interpret what it sees.
It’s faster, more intuitive, and closer to how traders already analyze markets manually.
This becomes especially useful during active sessions when you want a quick second opinion without interrupting your workflow.
Sometimes I use AstraCharts AI simply to see whether the AI notices something I may have overlooked structurally. Other times it helps validate whether a setup still aligns with the broader market context.
That’s usually where the real value comes from — not prediction, but perspective.
Using Different AI Models Inside AstraCharts AI
Another thing I wanted from the beginning was flexibility.
Different AI models behave differently when analyzing charts. Some models like claude Sonnet tries to be too helpful so provides more detailed explanations, while others respond faster or structure their reasoning differently.
That’s why AstraCharts AI supports multiple AI providers instead of locking users into a single model.
Currently, traders can connect:
- ChatGPT
- Claude
- Gemini
The extension itself doesn’t include the API access directly. Users bring their own API key from the provider they want to use — it’s a free tool, you don’t expect me to pay for that, or do you?
In practice, the setup process is straightforward.
First, you generate an API key from your preferred AI provider. Then you paste that key into the AstraCharts AI extension settings.
For traders looking for a free option, Google currently offers Gemini API access through Google AI Studio, which works well with the extension and is enough for many traders getting started.
I actually recommend that route for most beginners because it allows them to test AI chart analysis without committing to paid API costs immediately.
How To Use AstraCharts AI
Getting started only takes a few minutes.
Step 1: Get an AI API Key
Before using the extension, you’ll need an API key from:
- OpenAI (ChatGPT)
- Anthropic (Claude)
- or Google Gemini
If you want a free option, you can create a Gemini API key through Google AI Studio.
Step 2: Install the Extension
Download and install AstraCharts AI on Chrome.
Once installed, open TradingView or another supported charting platform.
Step 3: Add Your API Key
Open the extension settings, select model, and paste your API key.
This connects the extension to the AI model you want to use.
Step 4: Choose an Agent (Strategy)
You can:
- use one of the default strategies (ICT or Market Profile)
- build your own custom strategy
- click on “save settings” button
Step 5: Capture a Chart Screenshot
Click the camera button on the floating chatbox on the right bottom corner of your screen
The extension captures the chart automatically and sends it to the selected AI model for analysis.
The AI will then interpret the chart using that framework.
The AI analyzes the currently visible portion of the chart. If you want the analysis to include more or fewer candles, simply zoom in or out before capturing the screenshot.
Step 6: Ask Follow-up Questions
Once the analysis is generated, you can continue the conversation directly in the chatbox. You can ask for clarification, deeper breakdowns, or even questions about the strategy used to analyze the chart. This also makes AstraCharts AI useful for learning and understanding trading strategies through real market charts in context.
The Biggest Misunderstanding About AI Trading Tools
One thing I think the trading industry gets wrong is the obsession with “AI signals.”
That framing creates unrealistic expectations.
AI is much better at assisting analysis than replacing trading judgment entirely.
In my experience, the best use cases are:
- reviewing market structure faster
- validating setups
- organizing technical observations
- reducing analysis fatigue
- learning new trading concepts
- comparing multiple perspectives
That’s a far more practical workflow than expecting AI to generate perfect trades automatically.
The traders getting the most value from AI right now are usually the ones already capable of thinking critically about the market themselves.
That said, I already made Astra charts AI more precise…
Where AI Chart Analysis Is Heading Next
One interesting thing I’ve been working on behind the scenes is combining screenshot-based analysis with direct OHLC market data access.
Right now, most AI chart analysis tools — including the current public version of AstraCharts AI — analyze charts visually from screenshots. That works surprisingly well for understanding structure, trend behavior, liquidity concepts, and overall market context.
But as we have discussed so far the visual analysis alone still has limitations when it comes to precise numerical accuracy.
To solve that, I’ve already built an internal version that can fetch OHLC data directly from the chart itself instead of relying only on image interpretation. That allows the AI to work with exact price values rather than estimated visual zones.
In practice, that means much more precise:
- support and resistance levels
- stop loss positioning
- take profit calculations
- key price areas
- structural validation
I’m still deciding whether that functionality will eventually become part of AstraCharts AI publicly, possibly as a future pro feature, but the early results are honestly very promising.
Final Thoughts
AI can absolutely analyze trading charts, and the technology is already far more useful than many traders initially expect.
Modern AI models are capable of understanding market structure, trend behavior, liquidity concepts, and overall chart context directly from screenshots. Used correctly, AI-assisted analysis can significantly speed up chart review workflows and provide valuable second opinions during active trading sessions.
At the same time, image-based analysis still has limitations when it comes to exact numerical precision. While AI can usually identify important zones and structural areas visually, precise entries, stop losses, and take profit levels are harder to calculate reliably from screenshots alone.
That’s one reason newer hybrid approaches are becoming increasingly interesting. Internally, AstraCharts AI has already been tested with direct OHLC market data integration alongside visual chart analysis, allowing the system to work with exact price values instead of relying only on image interpretation. Those capabilities may eventually become part of future pro features, although the current screenshot-based workflow remains the fastest and most accessible approach for most traders.
Ultimately, the biggest strength of AI trading tools is not replacing traders, but helping them as an assistant to analyze markets faster, organize technical ideas more efficiently, and reduce analysis fatigue during real trading sessions.
That’s where tools like AstraCharts AI fit best:
not as magic signal generators, but as AI-powered chart analysis assistants designed around how discretionary traders actually work.
Frequently Asked Questions
Yes. Modern multimodal AI models can interpret TradingView screenshots and analyze chart structure, trends, and technical patterns visually.
AI chart analysis is generally accurate for identifying structure, trends, and market context, but less reliable for precise price levels or exact trade entries. It should be used as a supporting tool rather than a standalone trading system.
AI can identify likely support and resistance zones by analyzing price reactions, consolidation areas, and structural highs and lows. However, these levels are usually interpreted as zones rather than exact price points.
Yes. AI can recognize common chart patterns such as triangles, flags, channels, head and shoulders, and breakouts. The accuracy depends on chart clarity and the context of the market structure.
Yes. AI can interpret candlestick formations and their context within a broader trend, including momentum shifts, rejection candles, and continuation signals.
Yes. AI is increasingly used as a technical analysis assistant to speed up chart review, highlight potential setups, and provide structured interpretations of price action. It is most effective when combined with human decision-making.
No AI system can reliably predict market movements. AI can analyze probabilities based on chart structure and historical patterns, but markets are influenced by unpredictable factors such as liquidity, news, and macroeconomic events.
AI is not better or worse than manual analysis—it is different. AI is faster at processing visual information and spotting structural patterns, while human traders are better at context, experience-based judgment, and risk decisions. The strongest approach is combining both.
Yes. Beginner traders often use AI to learn chart reading, understand technical patterns, and get explanations of market structure in a simplified way. It can act as a learning and analysis companion.